Introduction
Recently, during the Cool Neighbourhoods knowledge exchange activities at the Joint Research Centre Zeeland (JRCZ) in Middelburg, MSc Urban Environmental Management student Sara Babili presented research examining the relationship between urban form and land surface temperature (LST) in Middelburg.
Building upon the previous article exploring Digital Twin development, citizen science, and data-driven climate adaptation approaches within Cool Neighbourhoods, this session focused on how satellite analysis and spatial assessment can support targeted urban heat interventions.
The research concentrated particularly on Edelstenenbuurt — a socially vulnerable neighbourhood within Middelburg — providing valuable evidence to support future climate adaptation planning and Neighbourhood Heat Stress Action Plans (NHSAPs).
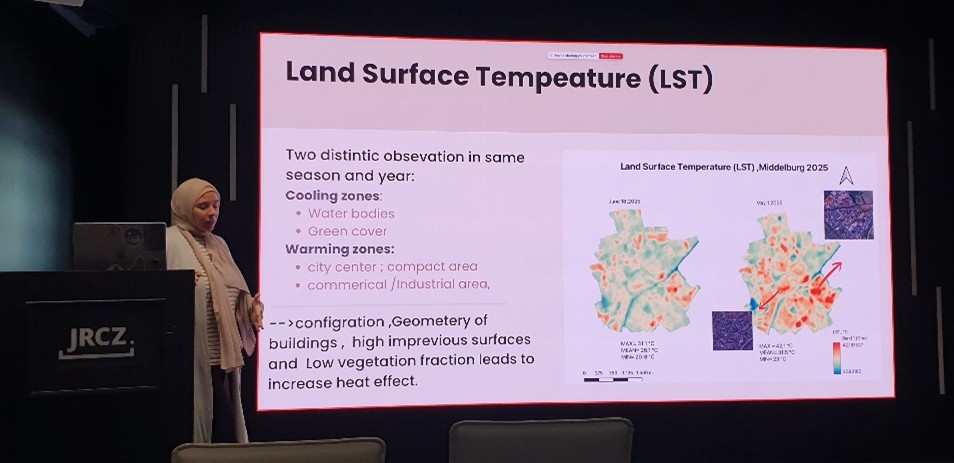
IMAGE: Sara Babili presenting at JRCZ
Sara Babili presenting spatial analysis findings
examining the relationship between urban form and heat accumulation in
Middelburg.
Understanding Urban Heat Through Spatial Analysis
Urban heat stress occurs when built-up urban areas experience significantly higher temperatures than surrounding rural environments due to the Urban Heat Island (UHI) effect.
The presentation highlighted how factors such as:
• Dense urban form
• Impervious surfaces
• Limited vegetation
• Reduced airflow
all contribute to increased heat accumulation within cities.
Using remote sensing techniques and a Local Climate Zone (LCZ) classification framework, the study analysed how different neighbourhood typologies influence surface temperature patterns across Middelburg.
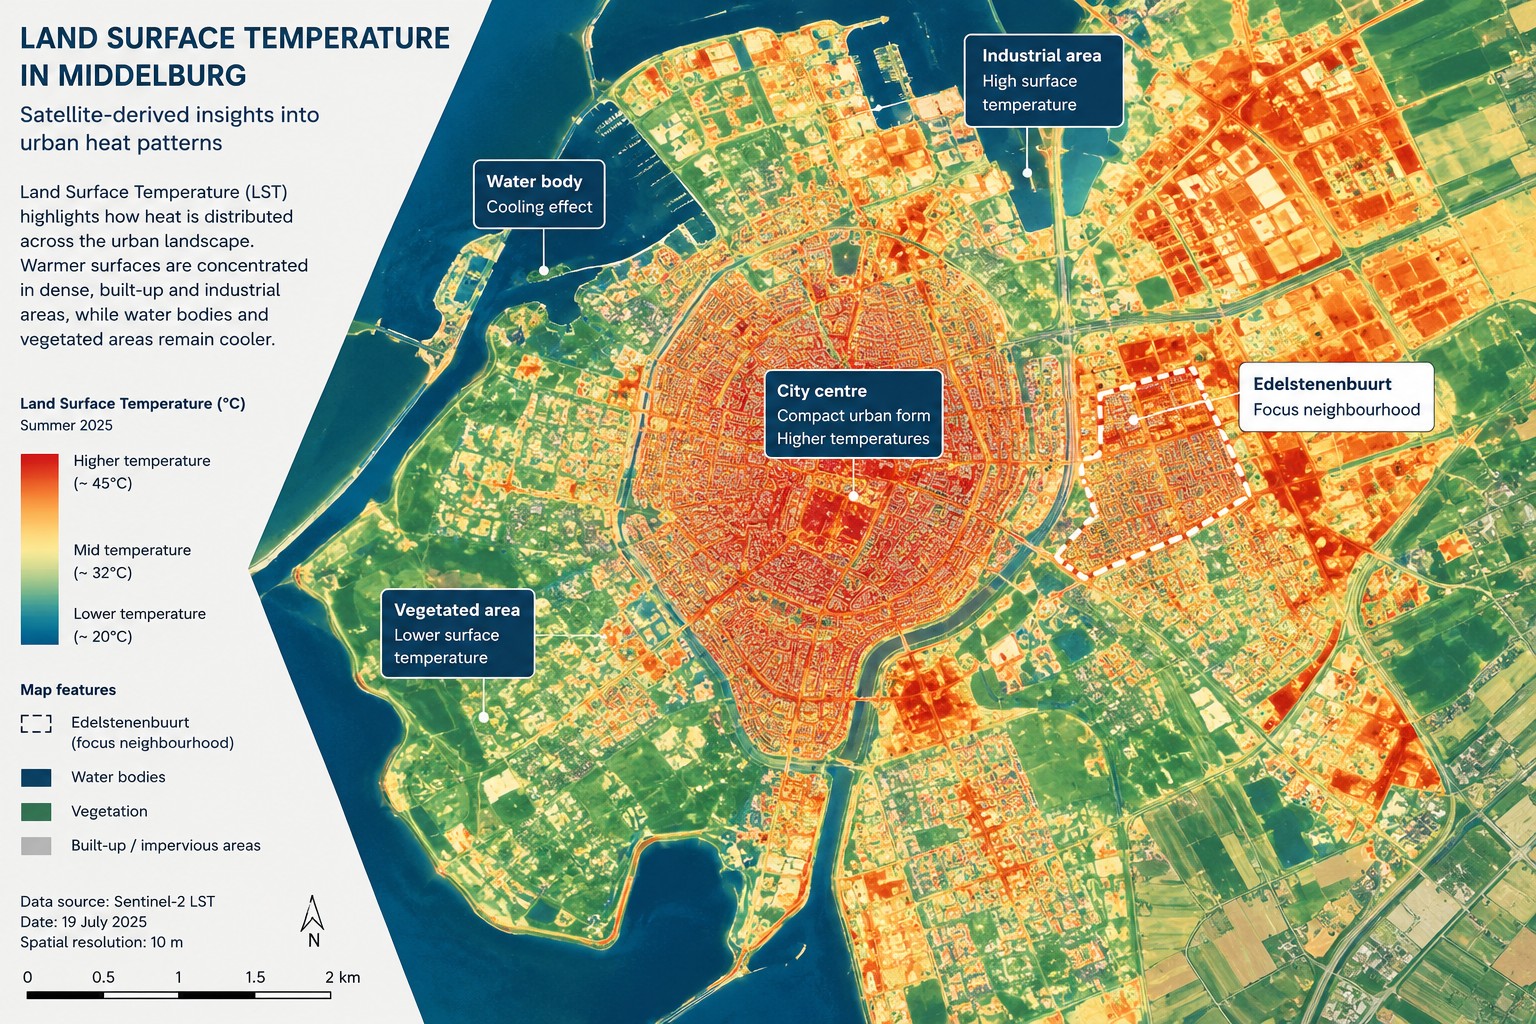
IMAGE: Middelburg heat mapping / satellite
analysis visual
Spatial heat mapping and satellite-based analysis help
identify how urban structure influences land surface temperature across
neighbourhoods.
Impervious Surfaces and Structural Heat Accumulation
One of the key findings presented was the strong relationship between impervious surfaces and elevated temperatures.
Land Use / Land Cover (LULC) analysis of Edelstenenbuurt demonstrated a clear dominance of grey infrastructure with relatively limited green coverage.
The study showed that:
👉 Built-up areas intensified temperatures by up to 1.5°C compared to natural surfaces.
Cooling zones were consistently associated with:
• Water bodies
• Vegetated areas
• More open spatial configurations
while warming zones were concentrated in:
• Compact city areas
• Industrial zones
• Dense low-rise urban structures
The findings reinforce the importance of targeted interventions within vulnerable neighbourhoods.
Beyond Greening: Why Urban Morphology Matters
An important conclusion from the research was that vegetation alone is not the only factor influencing urban heat.
The analysis demonstrated that urban morphology — including building height, density, spacing, and configuration — independently affects thermal behaviour.
Certain open urban forms showed cooling potential due to:
• Improved ventilation
• Increased shading
• Reduced heat entrapment
This shifts climate adaptation thinking beyond generic greening policies towards more integrated, evidence-based urban design strategies.
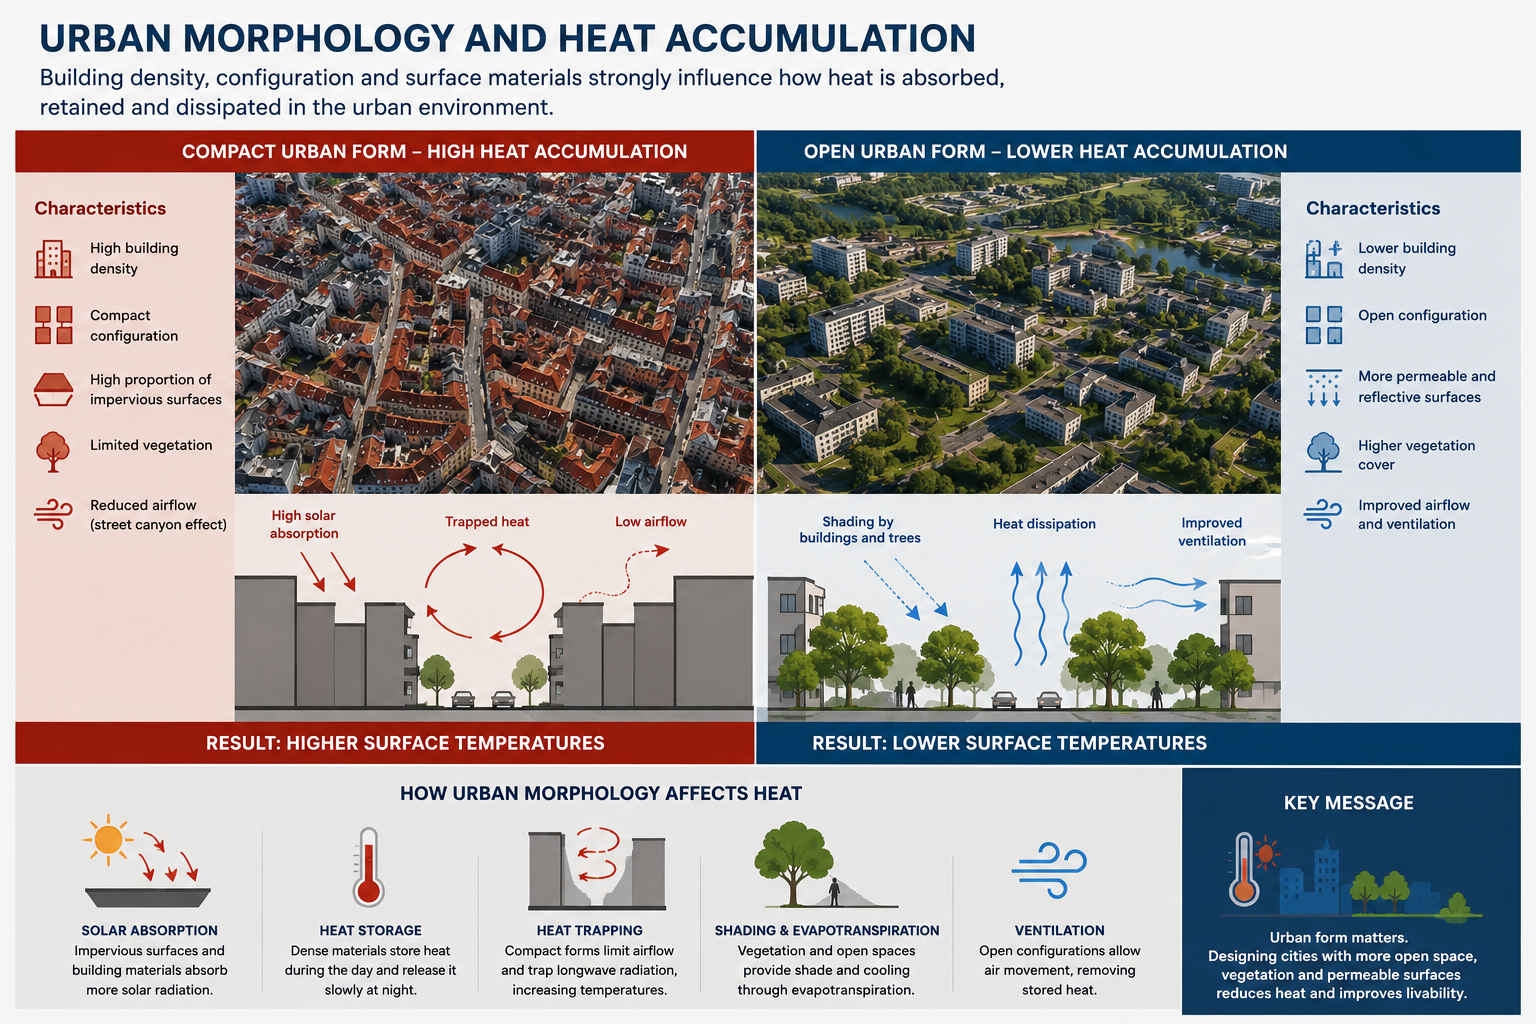
IMAGE: Urban form / heat accumulation visual
Urban morphology, building density and spatial
configuration all influence how heat accumulates within cities.
Supporting Neighbourhood Heat Stress Action Plans (NHSAPs)
The research directly supports the development of targeted interventions within Cool Neighbourhoods by:
• Identifying high thermal response zones
• Supporting evidence-based planning decisions
• Prioritising areas for greening investment
• Strengthening climate resilience strategies
Importantly, the work demonstrates how combining spatial analysis, remote sensing, and local knowledge can help municipalities make more informed adaptation decisions.
This also complements the wider digital and data-driven approaches being explored within Cool Neighbourhoods, including Digital Twin development and citizen science methodologies.
From Data to Livability
Heat stress disproportionately affects socially vulnerable neighbourhoods.
By linking satellite-derived analysis to neighbourhood typologies and local conditions, the study connects environmental data directly to questions of:
• Thermal comfort
• Public health
• Social equity
• Urban livability
This reinforces an important principle emerging across the Cool Neighbourhoods project:
👉 Climate adaptation is not only an environmental challenge — it is also a livability challenge.
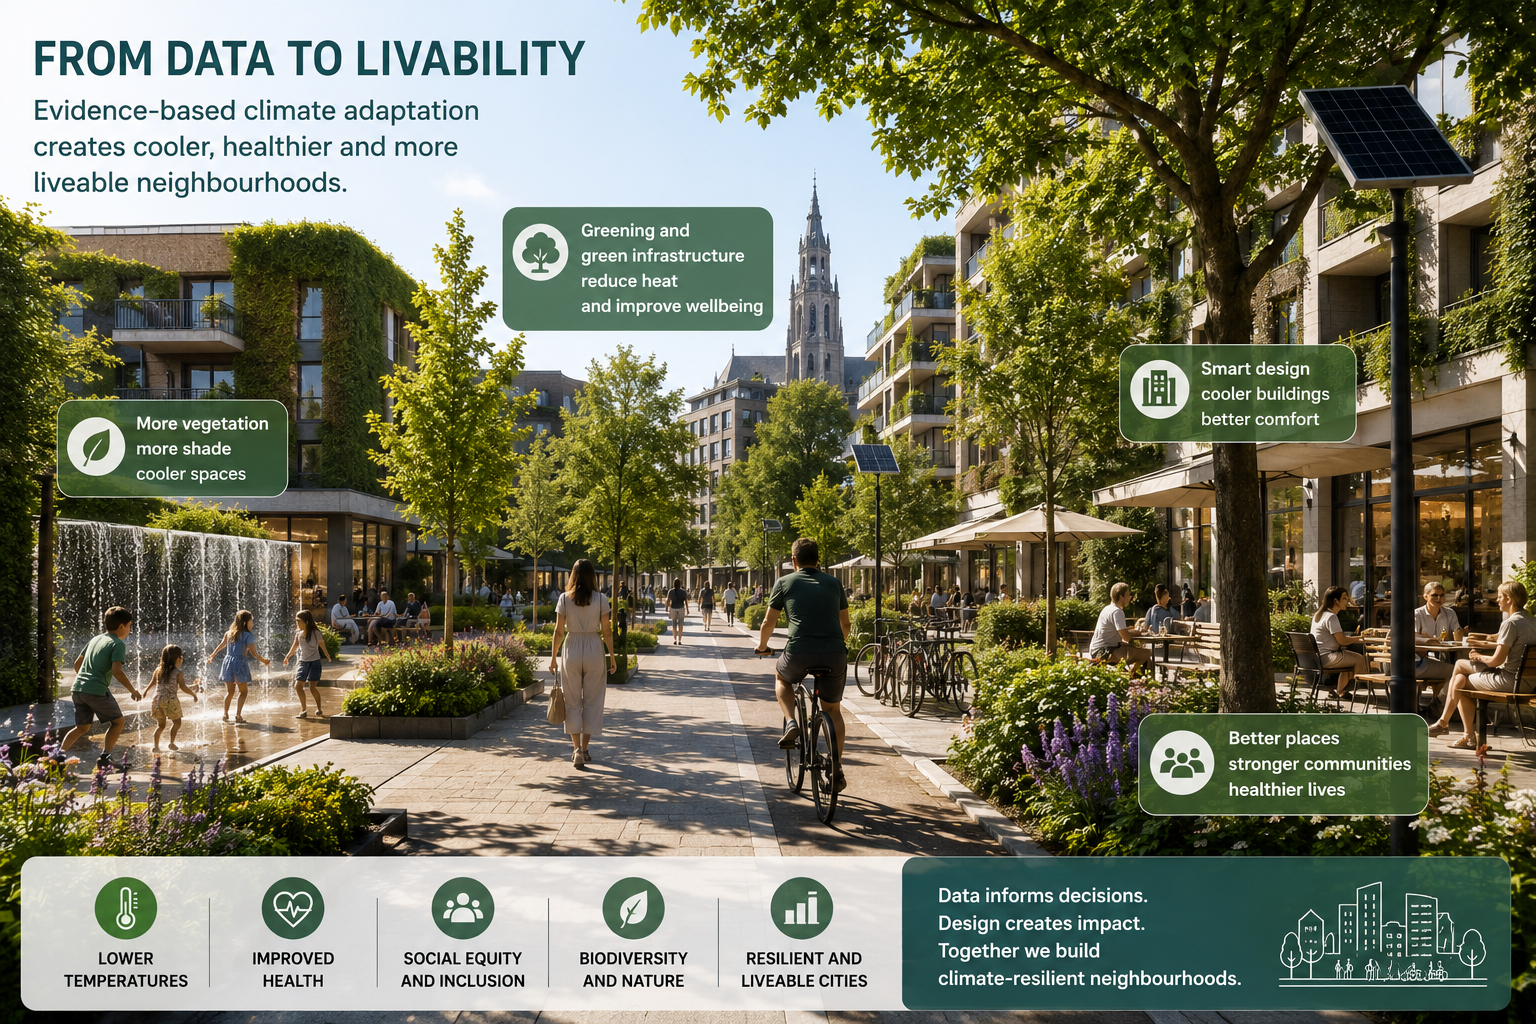
IMAGE: Grey to Green / future resilient
neighbourhood image
Evidence-based climate adaptation supports cooler,
healthier and more liveable neighbourhoods across Europe.
Conclusion
The presentation demonstrated how satellite analysis, spatial assessment, and morphology-informed planning can strengthen climate adaptation strategies within cities.
Together with Digital Twin development, citizen science, and evidence-based planning approaches, this work helps build a stronger technical foundation for Cool Neighbourhoods while supporting transferable knowledge for other North-West European regions facing similar urban heat challenges.
The session reinforced the growing importance of combining digital innovation, spatial intelligence, and practical implementation to support long-term urban resilience and livability.